Vivian van Oijen
Ik hoor bij het High Performance Machine Learning team van Surf, waar ik… Meer over Vivian van Oijen
In this brief experiment, we are teaming up with a group of researchers from Radboud University led by Joep van der Graaf and Inge Molenaar (https://www.ru.nl/bsi/research/group-pages/adaptive-learning-lab-all/design-development-innovative-learning/flora-project/) to investigate the potential of machine learning in the field of self-regulated learning (SRL). SRL is a process where students employ strategies to learn effectively, such as task planning, performance monitoring, and reflection on outcomes. Self-regulation abilities include goal setting, self-monitoring, self-instruction, and self-reinforcement. With this project, SURF is supporting research about “learning to learn”. By helping people develop self-regulated learning skills, we can help them become more effective and efficient learners, which can lead to better academic and professional outcomes.
Until now, extracting learning processes is mostly done based on researchers’ theory. By using machine learning, specifically unsupervised methods, we create a more data-driven approach. Our model learns to detect patterns from data and because it is unsupervised, that data does not need to be labeled.
To start with, we need some way of monitoring a student’s actions during a learning task. We use a dataset from a project called Lighthouse that our collaborators are working on (https://www.versnellingsplan.nl/Kennisbank/flora-lighthouse/), where participants write an essay on a topic in a digital environment. Within this environment, participants can read and take notes on the subject, making it possible to observe all their actions, including planning, reading, writing, and checking the time. This gives us a big pile of raw trace data of every action each participant takes. But how do we go from this raw data to insights about learning processes?
In the image below we show the subsequent steps needed to find these processes. Starting with raw data like keyboard presses and mouse movements, the first step is to translate this data to learning actions. Examples of learning actions are navigation, relevant reading and writing. Once we have this sequence of actions, the next step is to find learning processes, or patterns, such as planning and monitoring. Finally, once we have a lot of this data and have extracted learning processes, we can create a process model that shows the probability of moving from one process to another.
The first step is relatively simple as this is a one-to-one function to individual actions. The second step is where it gets more interesting, as this is where patterns need to be identified. This is the step we focus on during this experiment.
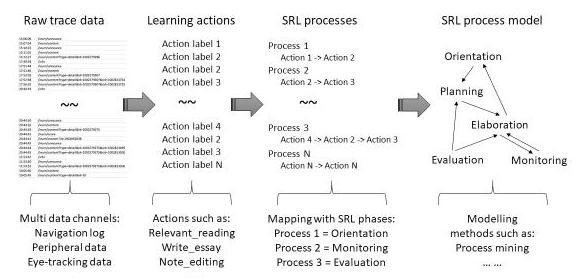
In recent work, our collaborators at Radboud have proposed a new pipeline for extracting learning processes. This pipeline integrates a data-driven perspective, but it still relies primarily on theory. The data-driven perspective enhances the validity of the extracted processes, but does not do the mapping from trace data to learning actions (step 1) or from actions to processes (step 2). Therefore, we aim to design a fully data-driven pipeline that does the mapping from actions to processes. This is where machine learning comes in.
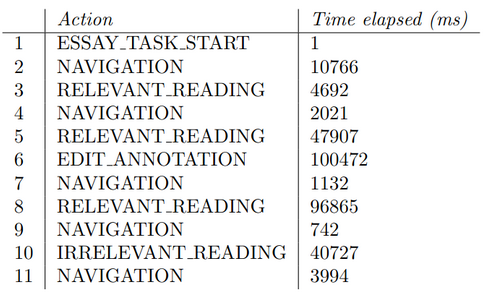
Our input consists of the complete sequence of individual actions performed by each participant, along with the corresponding duration of each action. The example below shows a portion of the action sequence performed by a participant, as well as the time taken for each action. Our goal is to sample sequences from this data and identify patterns.
Identifying patterns is what machine learning models excel at; however, we do not have a ground truth to compare our model to. There are process labels available that were obtained with previous methods that are based on theory, but assuming those labels to be true means we would be memorising that theory instead of learning objectively from data. Instead, we explore unsupervised methods that do not need labels.
First off, we need a way to represent individual actions in a numerical way, so that we can do calculations with them. We learn these representations, or embeddings, using a Long Short-Term Memory Neural Network (LSTM). LSTMs are a type of recurrent neural network that have been used most prominently as language models, but are effective for learning sequential data in general. For our task of modeling learning action sequences, we train the LSTM on next-action prediction by feeding it a sequence from our dataset and having it predict the next action. This is illustrated below. By performing this task, the model automatically learns to represent actions as well as sequences with numerical embeddings.

After training the LSTM, we can use it to embed sequences of actions. Now we have our numerical representations! Using those, we can apply other methods. Let’s start by visualising the embedded action sequences, to get a feeling of what they look like. The embeddings we learn for sequences are 512-dimensional, which we cannot visualise directly. That’s why we use t-distributed Stochastic Neighbor Embedding (t-SNE) to map each of these 512D embeddings to a point in a 2D space. This is the resulting visualisation of that mapping:
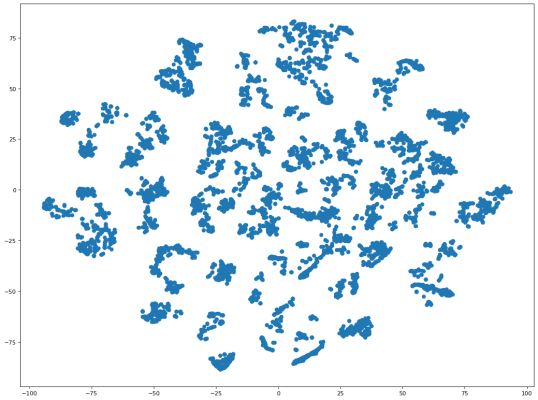
This in and of itself does not tell us much, except that there do appear to be clusters. Let’s zoom in on one of the clusters.
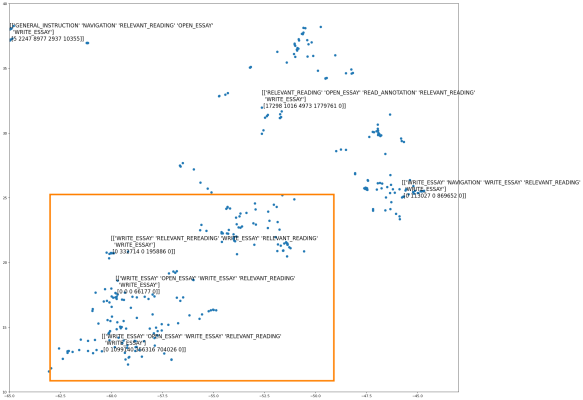
It seems that similar sequences are indeed grouped closer together; the sequences within the orange square are more alike to each other than to the sequence outside the square. Another way to check this is to compute the cosine distance between sequences. We look at two examples, one of two similar sequences and one of dissimilar sequences.
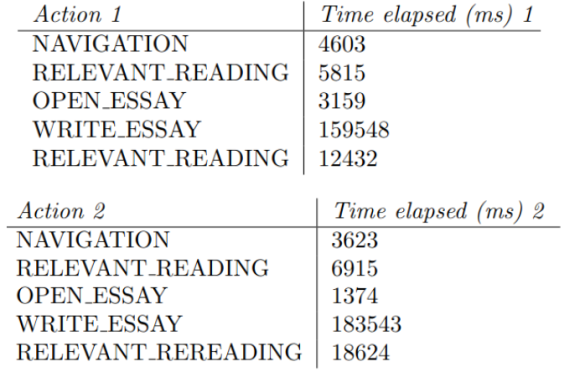
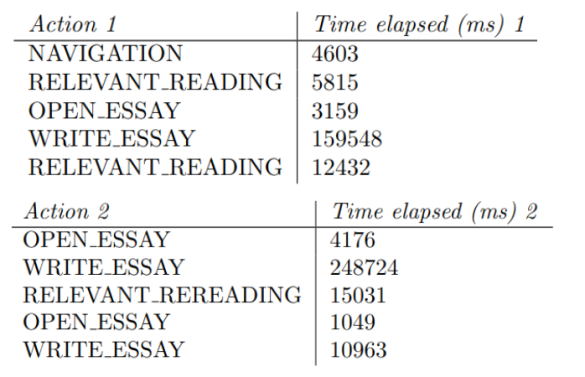
The two sequences above are quite similar and indeed, the cosine distance is only 0.055. This means they are numerically close too. In contrast, the two sequences below are much more different. That shows in the cosine distance, which is 0.603 for this example, meaning they are numerically dissimilar.
Lastly we train K-means, a simple clustering algorithm. Unlike t-SNE, K-means does not reduce the dimensionality of the embeddings. This means we cannot visualise these clusters directly. Another challenge is that we have to choose in advance how many clusters we want. We make an estimated guess of k=36, based on the process labels found in SRL-theory. Now, properly evaluating our K-means is tricky as we have no ground truth. To assess the quality of our clusters, we calculated the Silhouette Score which ranges from -1 to 1, with 1 being the best score. Our model's Silhouette Score is 0.301, indicating moderately well-defined clusters. Additionally, we can again look at a few examples and see if results are as expected. Remember those two similar sequences with the low cosine distance? They were indeed classified as being in the same cluster!
In this short experiment, we investigated whether machine learning methods can aid pipelines used in this area of study. It has its limitations; evaluation of the methods used is not straightforward and K-means is a fairly simple baseline. Perhaps a more sophisticated algorithm could model SRL processes better. However, our purely data-driven pipeline shows promise by discovering patterns without relying on theory. This suggests that it could be worthwhile to further investigate the use of machine learning methods in SRL research. Clustered processes could provide new insights and potentially link to performance in learning tasks!
Ik hoor bij het High Performance Machine Learning team van Surf, waar ik… Meer over Vivian van Oijen
0 Praat mee