The digital world is generating data at an unprecedented rate. For data about research, or metadata, this is no different. So how do we integrate metadata and make sense of it all? PID graphs! Since there are existing graphs as well as graphs-in-the-making, SURF hosted a PID workshop to see what is brewing.
On Wednesday, 10 May, a group of 20—dare I say enthusiasts—gathered, the majority in person. Among us were researchers, architects, data specialists, and policymakers from universities, the e-Science Center, NWO, NATURALIS, and more. We kicked off with the following presentations on graphs:
-
RicGraph by Rik Janssen (Utrecht University)
-
OpenAIRE graph by Paolo Manghi (OpenAIRE)
-
DataCite graph by Matt Buys (DataCite)
-
National PID graph by Jeffrey Sweeney (Erasmus University Rotterdam)
Why PID graphs? A few reasons Paolo mentioned were discovery (to help researchers and beyond find what they are looking for), tracking (what is being produced in science), and monitoring (checking if we’re on the right track towards Open Science and adhering to its policies). For background information on how we landed on a national PID graph in the Netherlands, read Alastair’s blog here.
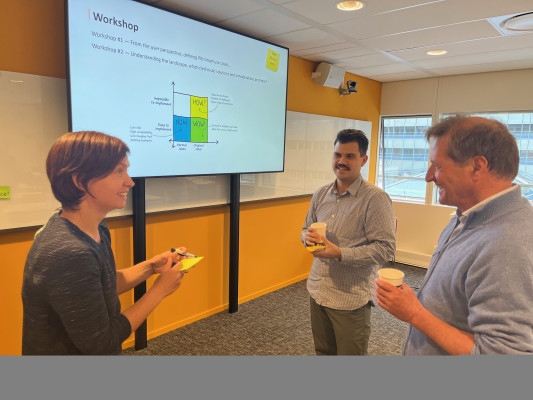
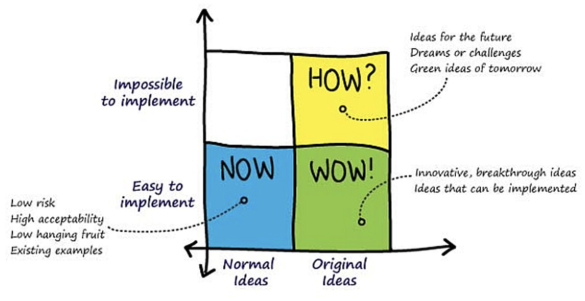
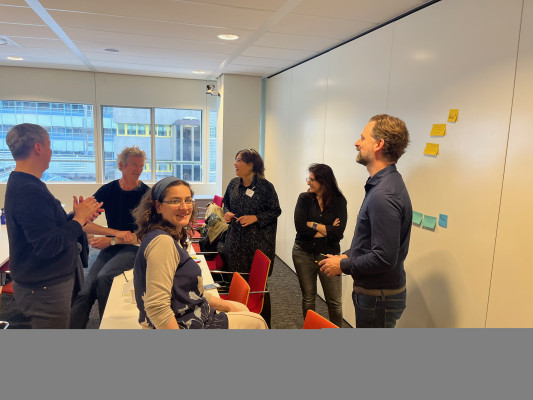
The presentations also sparked caution, “don’t trust metadata”, and questions on accuracy of metadata, the use of open-source software, and additional shared technical challenges. We then got everyone on their feet to brainstorm use cases using the how-now-wow method (image below). Ideas varied from the reuse and interoperability of researcher data and software to the tracking of research outputs and their impact, to quality assurance. There was talk of creating an automated reporting dashboard on metadata, only for some of us to find out it already exists! Suffice it to say, it was a morning well spent. Curious to hear about the national PID graph developments? Stay tuned...
Definitions for those who are unaware:
Persistent Identifier (PID) is a long-lasting reference to a digital source.
PID graphs are networks of PIDs that connect related digital objects or entities.
Read more about PIDs here or look into DataCite’s PID graph introduction.


0 Praat mee